
Our plots explained
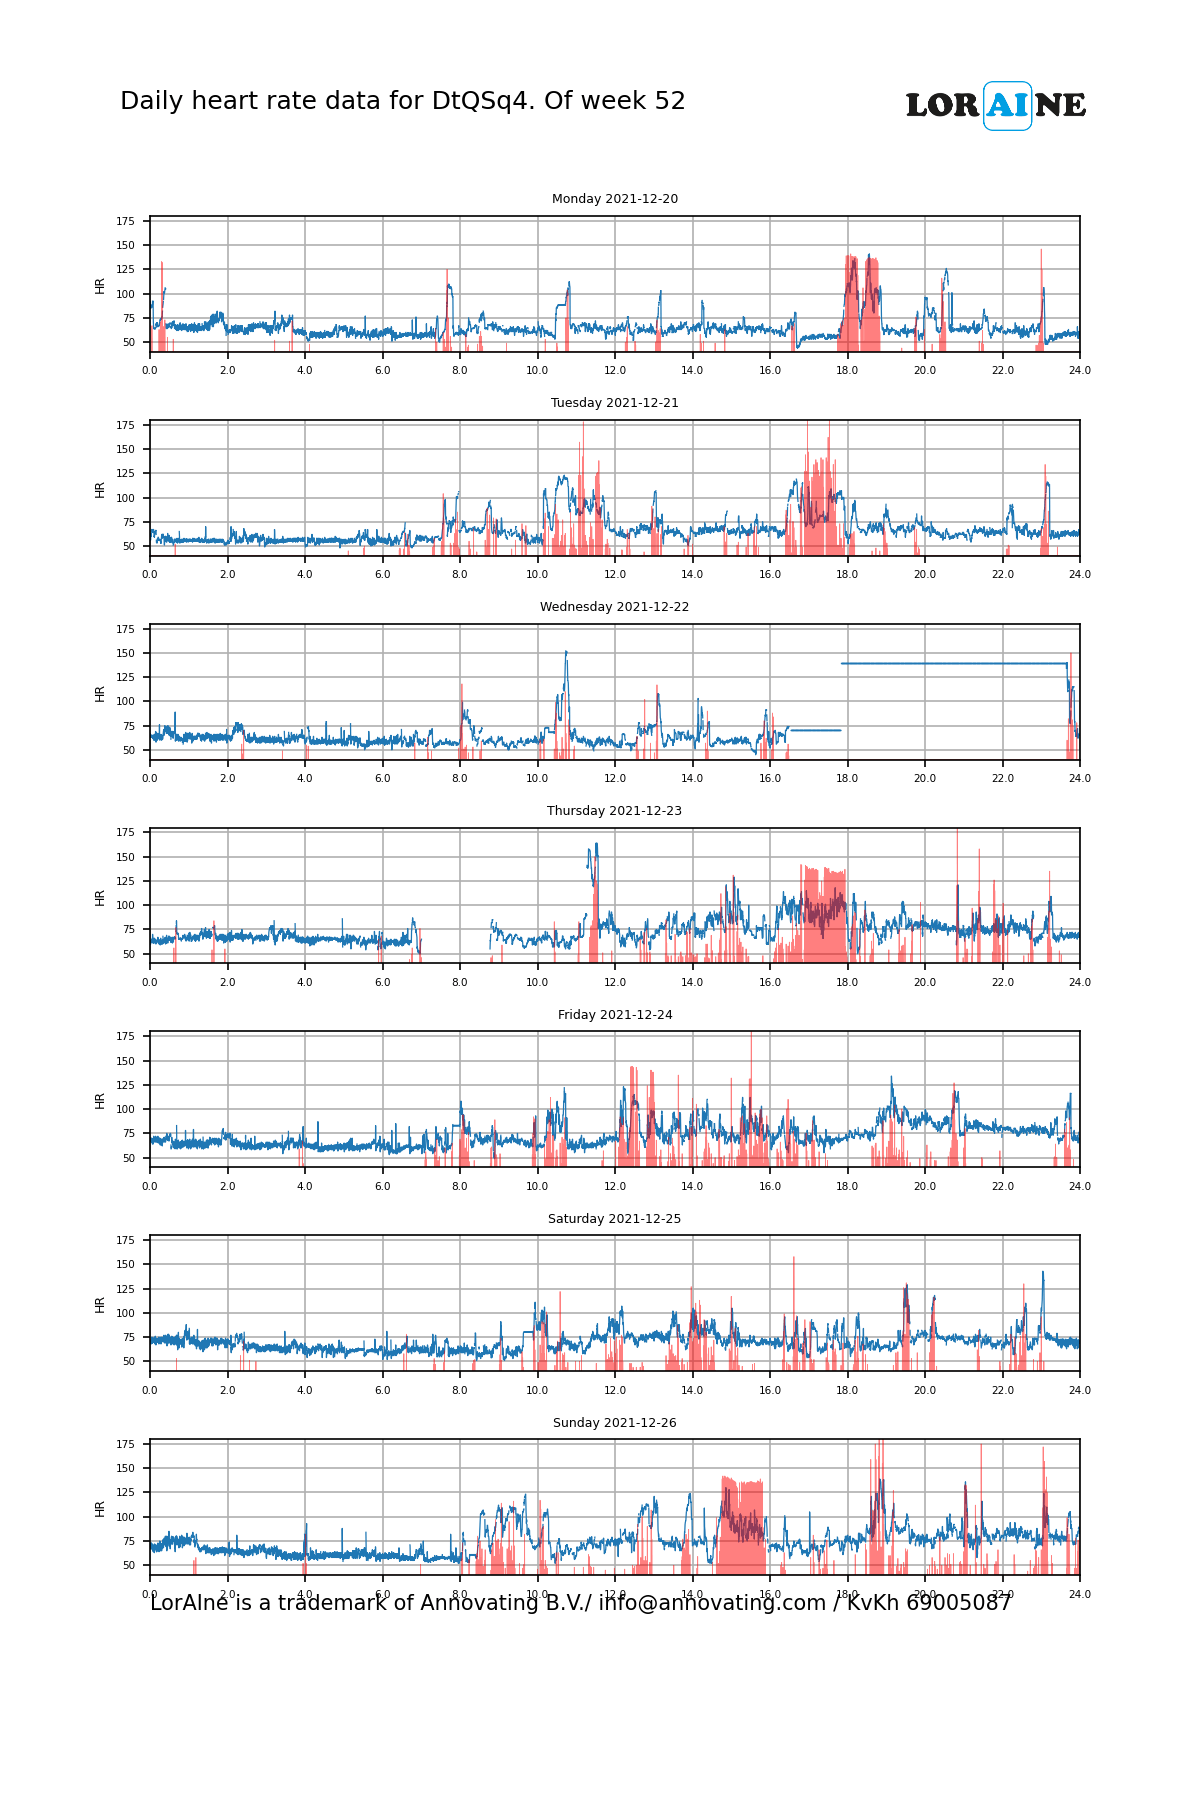
HR and STEPS data
HR data is plotted in blue. Seven days a week and for 24-hours.

HRV data
HRV is plotted in green. Also for seven days during 24 hours.

Weekly statistics
Press the figure for more information about typical values and the Karvonen heart rate zones
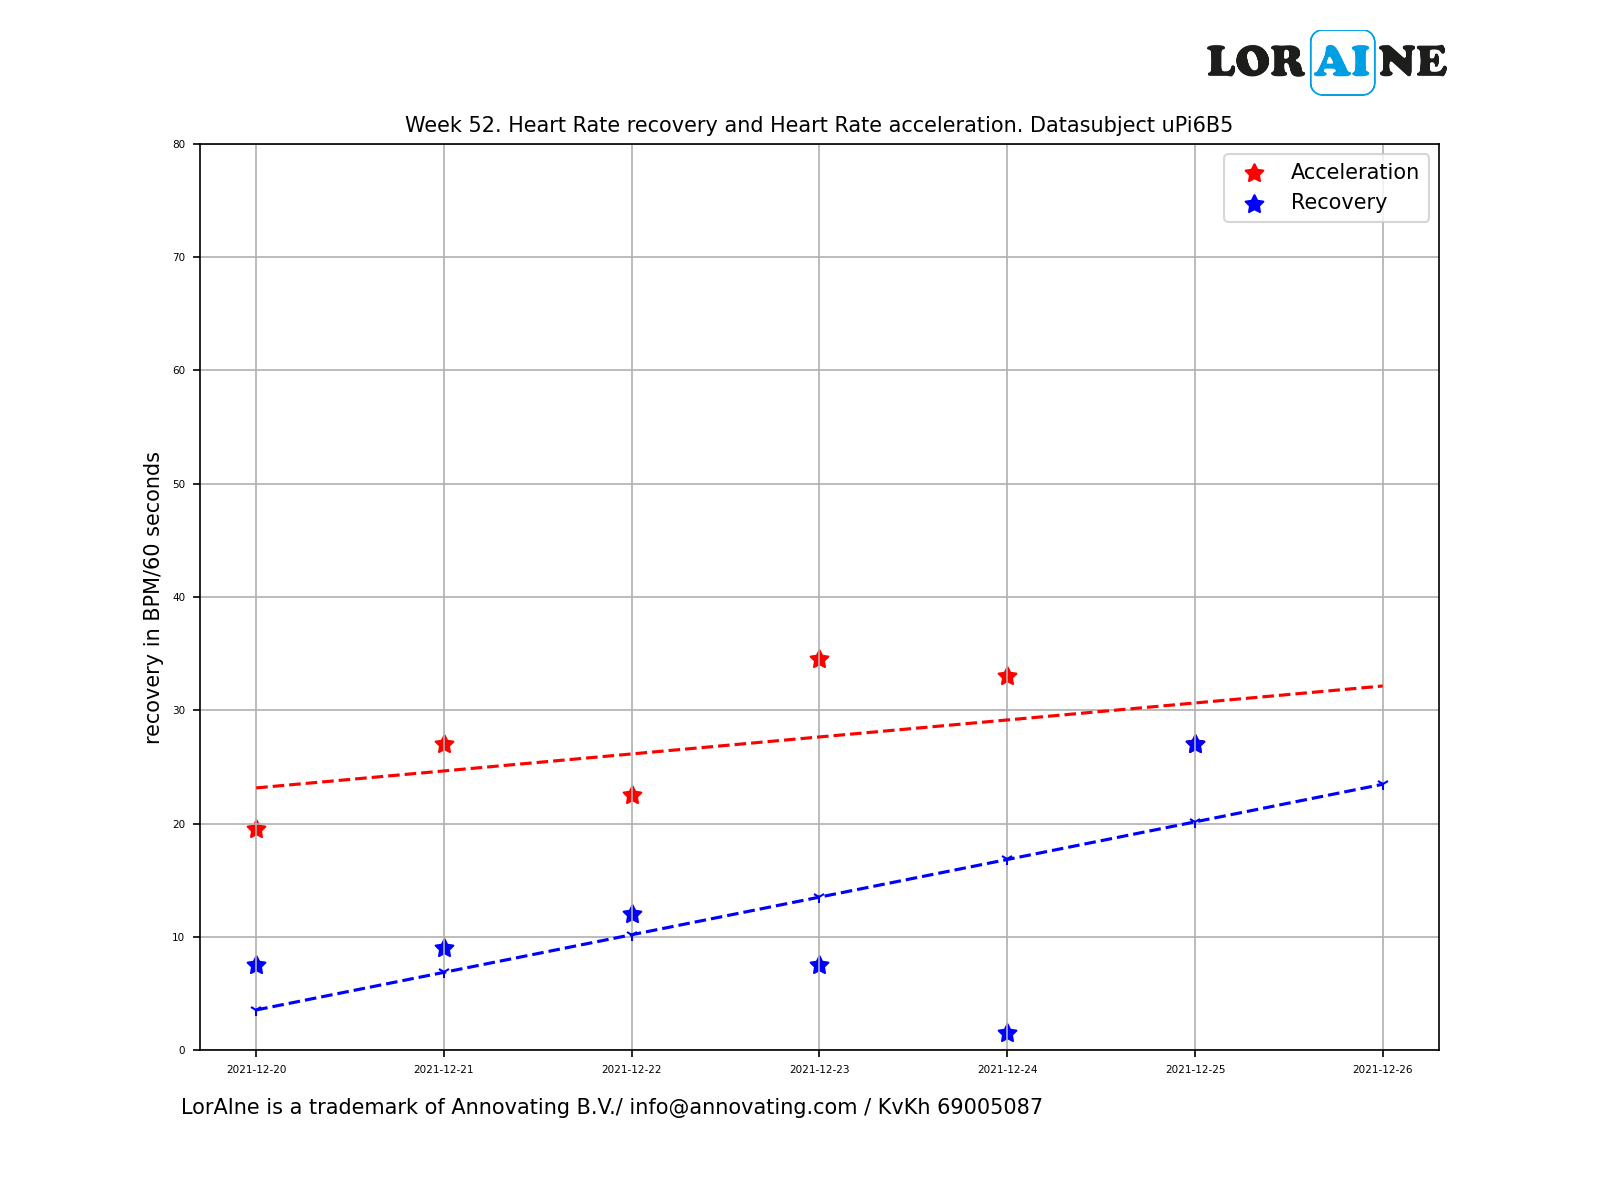
HR acceleration and deceleratin
During intensive action HR will accelerate. Ceasing action will let the HR decelerate. Fast deceleration is an indication of fitness